Rows and columns are fundamental components of any spreadsheet. Understanding the difference between them is key to organizing and analyzing data effectively.
In this guide, we’ll explain what rows and columns are, how they differ, and why they matter.
Let’s start with the basics.
What Is a Row?
A row is a horizontal line of cells in a spreadsheet. Each row is identified by a unique number on the left side of the sheet.
Rows run from left to right across the spreadsheet. They’re used to organize data horizontally.
For example, in a spreadsheet tracking sales data, each row might represent a different product.
- Row 1: Product A
- Row 2: Product B
- Row 3: Product C
In Google Sheets, rows are numbered starting from 1 and can go up to 10 million.
In Excel, rows are also numbered starting from 1, but the maximum number of rows is 1,048,576.
What Is a Column?
A column is a vertical line of cells in a spreadsheet. Each column is identified by a unique letter (or combination of letters) at the top of the sheet.
Columns run from top to bottom in the spreadsheet. They’re used to organize data vertically.
For example, in a spreadsheet tracking sales data, each column might represent a different month.
- Column A: January
- Column B: February
- Column C: March
In Google Sheets, columns are labeled with letters starting from A and can go up to ZZZ (18,278 columns).
In Excel, columns are also labeled with letters starting from A, but the maximum number of columns is XFD (16,384 columns).
What’s the Difference Between Rows and Columns?
The main difference between rows and columns is their orientation.
Rows are horizontal. Columns are vertical.
But there are other differences, too.
| Feature | Rows | Columns |
| Orientation | Horizontal | Vertical |
| Identified by | Numbers (1, 2, 3, …) | Letters (A, B, C, …) |
| Direction | Left to right | Top to bottom |
| Used for | Organizing data horizontally | Organizing data vertically |
| Maximum number in Google Sheets | 10 million | 18,278 |
| Maximum number in Excel | 1,048,576 | 16,384 |
How to Use Rows and Columns in Spreadsheets
Rows and columns are the building blocks of any spreadsheet.
They’re used to organize, analyze, and present data in a structured way.
Let’s look at how you can use rows and columns effectively in your spreadsheets.
Organize Data
The primary use of rows and columns is to organize data.
By placing data in rows and columns, you create a structured layout that’s easy to read and understand.
For example, in a spreadsheet tracking employee information, you might use columns for different types of information (like name, department, and salary) and rows for each employee.
Analyze Data
Rows and columns also allow you to analyze data.
You can use formulas and functions to perform calculations on the data in your rows and columns.
For example, you might use the SUM function to add up the values in a column or the AVERAGE function to find the average value in a row.
Present Data
Finally, rows and columns help you present data in a clear and organized way.
You can use features like sorting and filtering to arrange your data in different ways.
You can also use charts and graphs to visualize your data.
Tips to Differentiate Row and Column
An effective way to distinguish between a row and a column is to remember this rhyme: “row means left to right, column means height.”
Want a useful tool to detect common grammar mistakes? Try Humbot Grammar Checker! This tool can easily find out grammar errors from your inputs, see an example here:
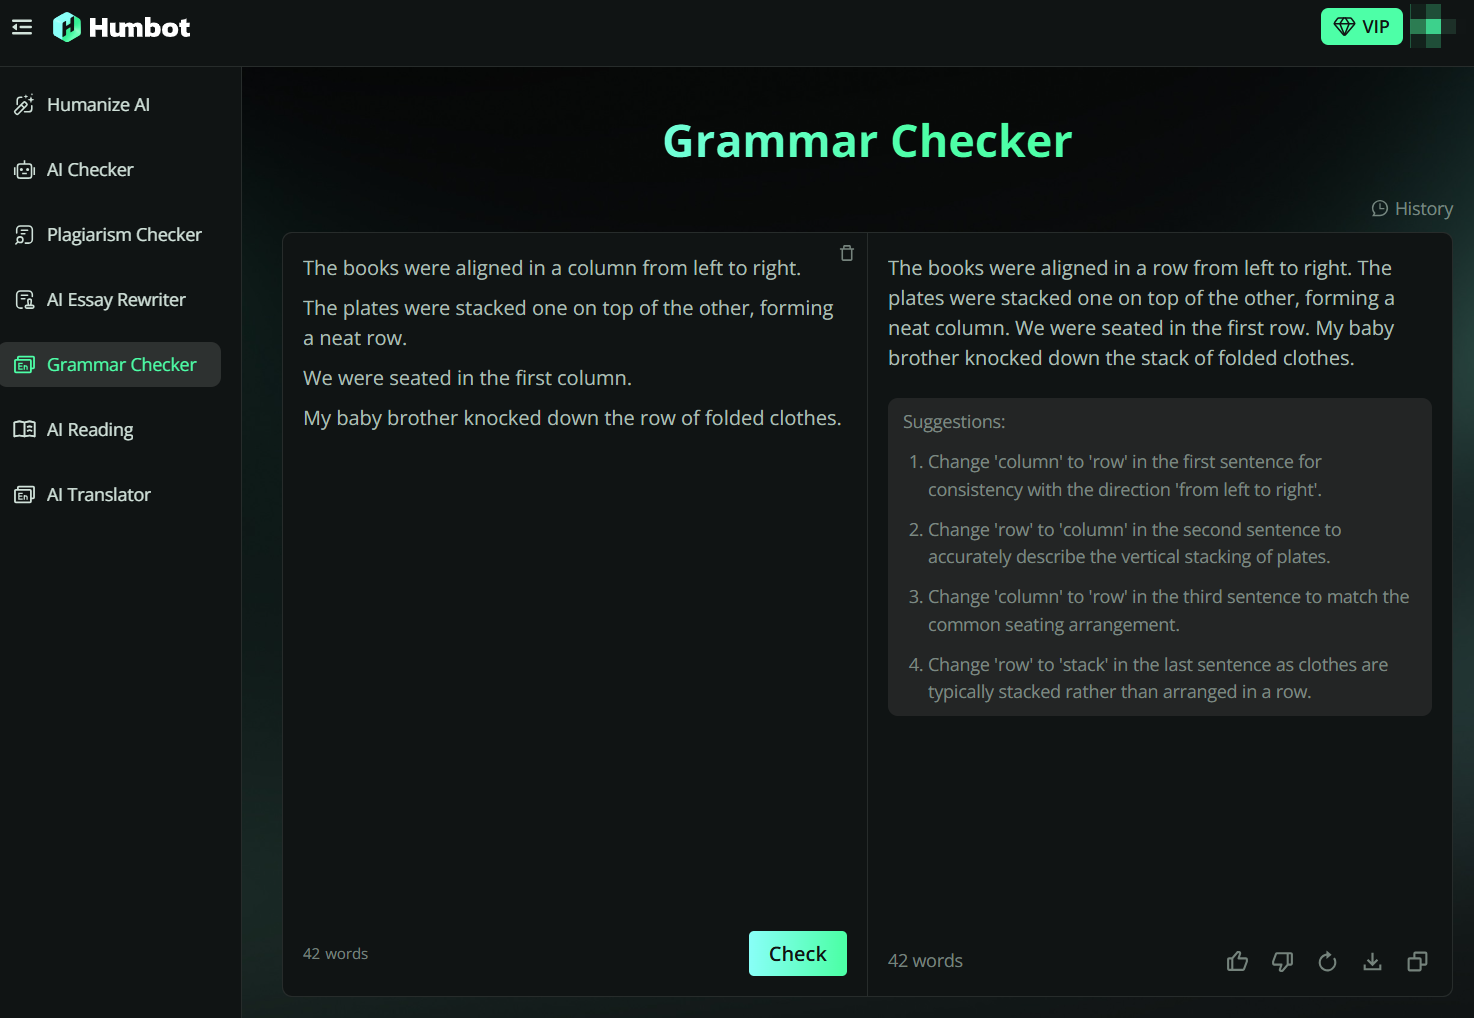
In addition to grammar mistakes detection, this tool can even provide detailed suggestions for you to improve your writing and style.
Conclusion
Rows and columns are essential components of any spreadsheet. They allow you to organize, analyze, and present data in a structured and meaningful way.
By understanding the difference between rows and columns, and how to use them effectively, you can make the most of your spreadsheets.